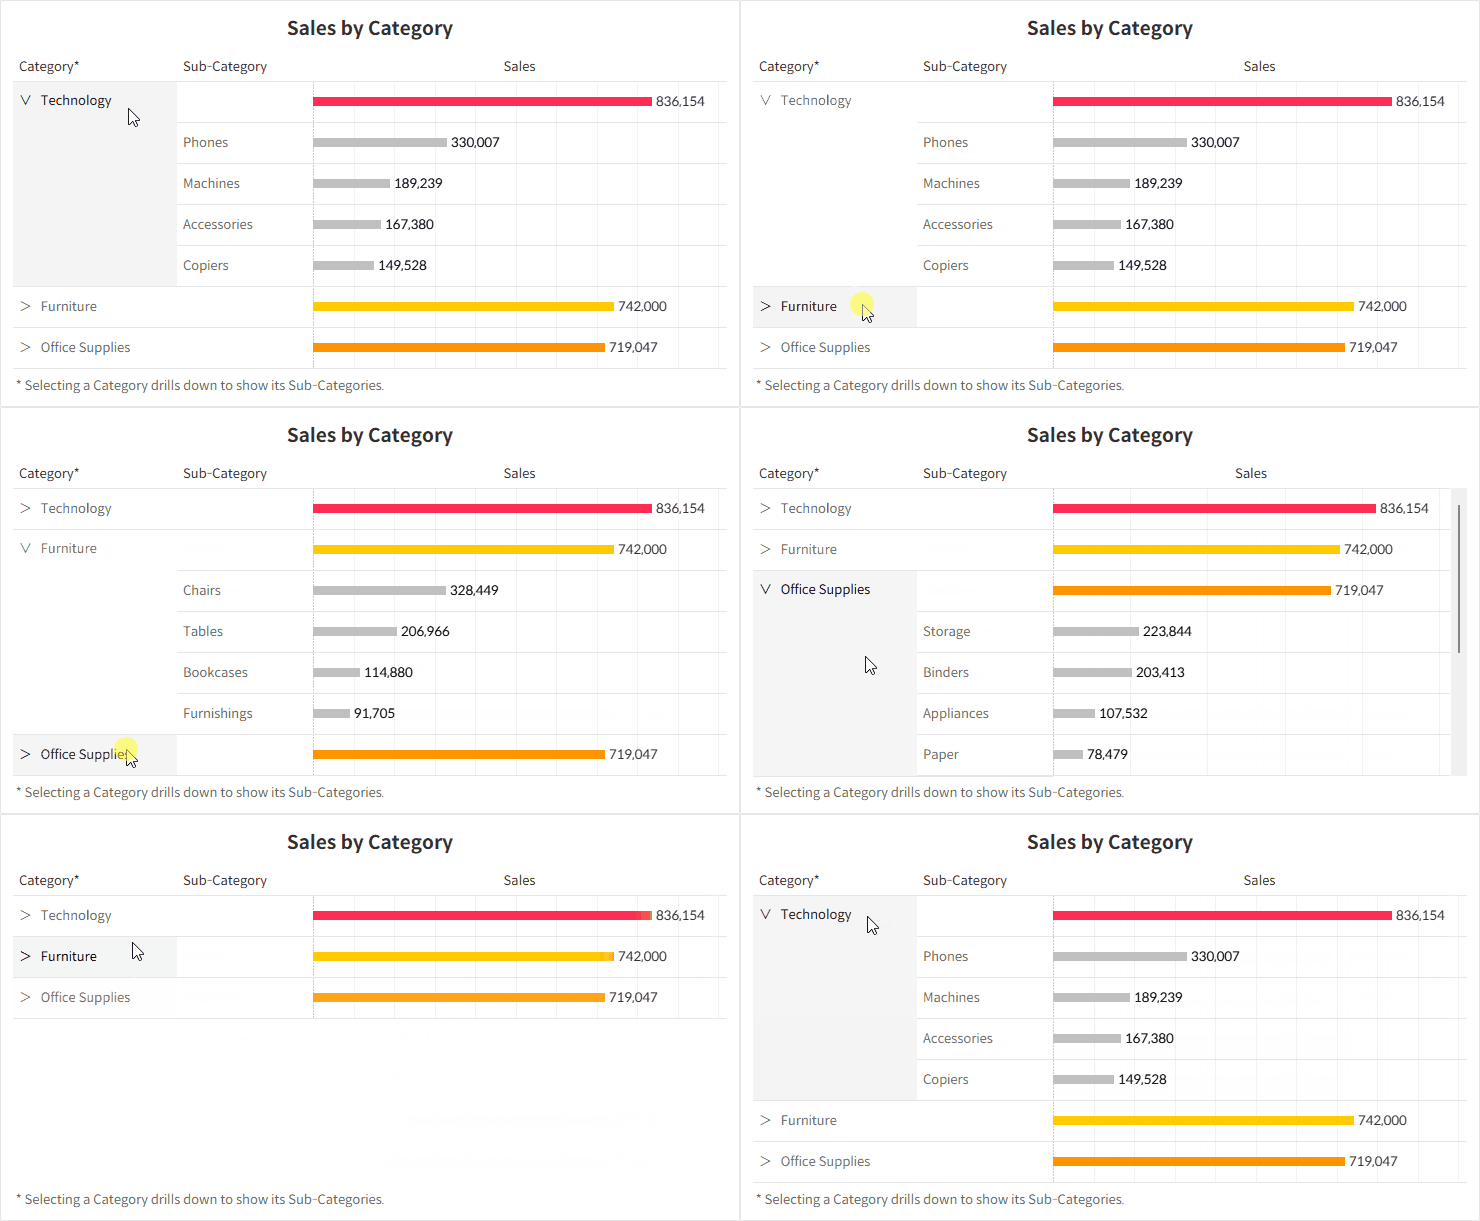
How to Drill Down a Single Row Hierarchy in Tableau
This guide will show you how to expand only the specific row you select to view its detailed items.

While Tableau provides a hierarchy feature, the UI representation can be very subtle, making it less intuitive for users. It also lacks flexibility if you want to drill down on selected items without affecting others.
In this article, we’ll look at a way to work around these limitations by expanding only the chosen row to reveal its sub-levels.
Step-by-Step: Drilling Down a Single Row Hierarchy
This approach uses a parameter action and subtotals to keep values visible at both the Category and Sub-Category levels.
- Create a parameter to capture the selected category item.

- Create a calculated field to add an arrow icon in front of the category name, guiding users to expand or collapse categories. If the parameter matches the value, display an expanded arrow icon (∨); if not, display a collapsed icon (>).

- Place the [Category] with arrows, [Sub-Category] on the Rows Shelf, and Sum of [Sales] on Columns shelf to create a bar chart. Sort both [Category] and [Sub-Category] in descending order of [Sales].

- Add Subtotals for the [Category], positioning them at the top. To enable Subtotals, first activate Grand Totals, then turn them off once Subtotals are enabled.

- Create a calculation to display only category subtotals and the selected category’s sub-categories. The SIZE function can help identify total and subtotal rows.

- Add the [Category TF] field to the Rows shelf to check results. Note that subtotal rows merge with the cell in front, so the value may not display.

- Hide any False values in the [Category TF] field. Be cautious not to filter them out directly, as doing so can lead to incorrect subtotal values.

- Create a calculated field to pass category values via parameter actions. If the parameter value matches the current category, pass a blank; otherwise, pass the category value, allowing users to collapse expanded items by selecting them again. Add this field to the Detail.

- Create a calculated field for category coloring, setting distinct colors for main categories and a uniform gray for sub-categories.

- Add the sheet to a dashboard and set up a dashboard action.

- Adjust formatting and sizing to finalize the dashboard.

💡
Other methods for displaying a hierarchy within a single dimension are available, though many involve data duplicate or complex LOD calculations, which may impact performance. Use them with care.

