How to Switch Between Sheets Using Buttons in Tableau
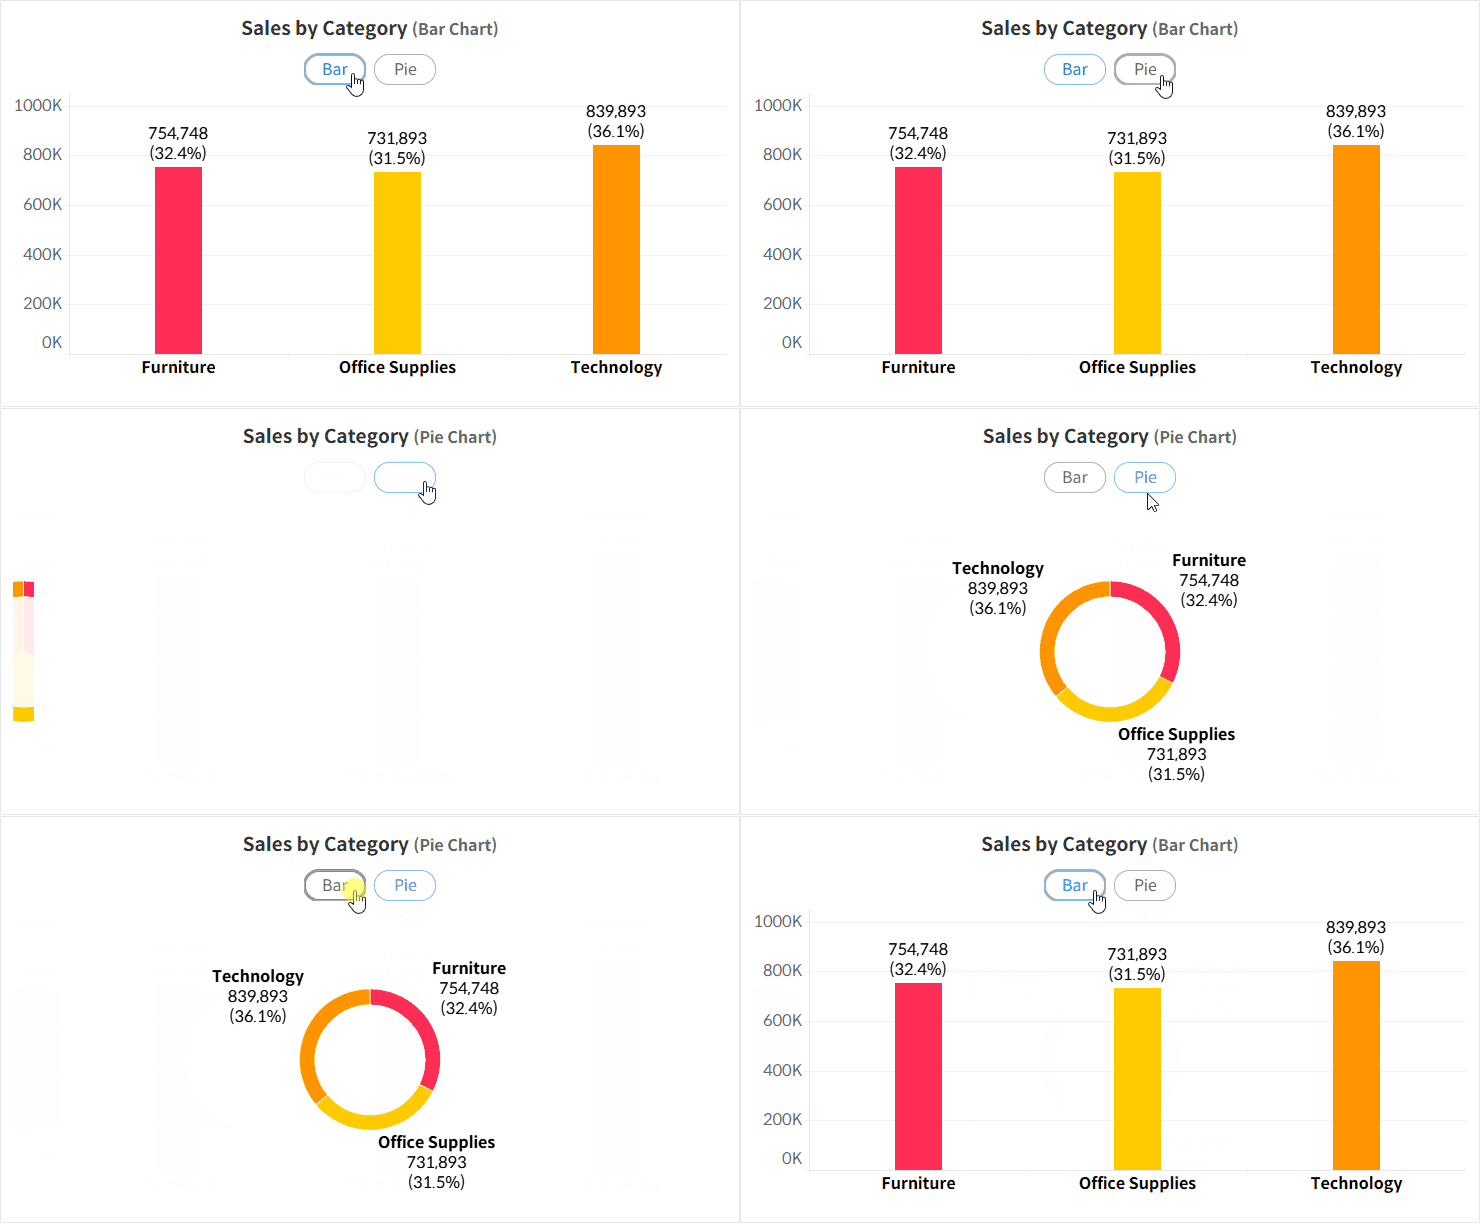
This tutorial shows you how to create a toggle button that lets users switch between two different sheets, displaying different chart types based on their selection.

In a previous post, I explained how to create a parameter button to switch between different measures. However, this method only changes the measure, not the chart type.

If you want to switch between chart types, like from a bar chart to a line chart, you'll need to create separate sheets for each chart and set them to show or hide based on the parameter value.
Step-by-Step: Switching between sheets using buttons
- Prepare the two sheets you want to toggle between.


- Place these sheets side by side in a horizontal container on the dashboard.

- Create a parameter that will receive input from the button.

- Design a sheet to act as the button and place it on the dashboard.


- In each sheet, create a calculated field that returns true only when the relevant parameter value is selected, then filter the sheets to display only true values.

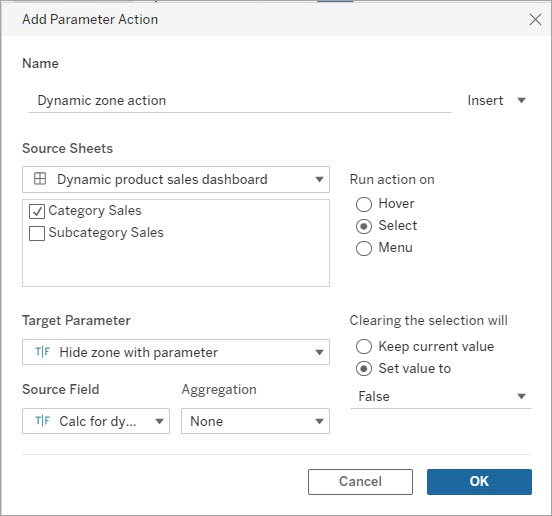
- Set up a parameter action in the dashboard to trigger the toggle.


- Add an action to clear the selection highlight after clicking the button.

- Test everything to make sure it works smoothly.

Troubleshooting: Removing Blank Space from Hidden Sheets
Sometimes, a sheet doesn’t hide properly and continues to take up space on the dashboard.

This seems to be a bug, and it typically happens when the row or column shelves are empty. Here’s a solution to fix the issue when this happens.

Method 1: Use Dynamic Zone Visibility Feature (Version 2022.3 and Later)
Select the pie chart sheet on your dashboard, then go to the Layout menu and set Control visibility using value to return true only when the chart type is a pie chart.


Method 2: Add a Blank Space to the Row or Column Shelf
Go to the pie chart sheet and add a blank value to the empty row or column shelf.

- To prevent this from affecting the sheet’s appearance, hide the headers.
- (Optional) Convert this blank space to Attribute to ensure it doesn’t impact table calculations.
For more details, you can download and review the Tableau file below.


