Trellis Arrangement in Tableau
This is a useful technique when there are too many items to display in a single row or column, making it difficult to compare them effectively.

In Tableau, there are cases where you need to display a large number of items in a single view without relying on scrolling. This need often arises in dashboard scenarios where it's important to see the overall status at a glance. When laying out all items in a single row or column isn't practical due to space constraints, a trellis layout can be an effective solution.
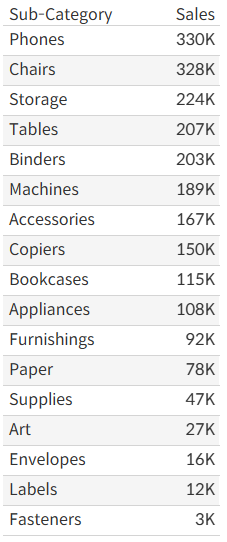
For example, using the Superstore dataset, let's say we want to display all 17 sub-categories sorted by sales. Displaying them in a single column or row would be too cramped, so instead, we’ll arrange them in a 6-row by 3-column grid layout.
Step-by-Step: Arranging Sub-Categories in a 6 x 3 Trellis
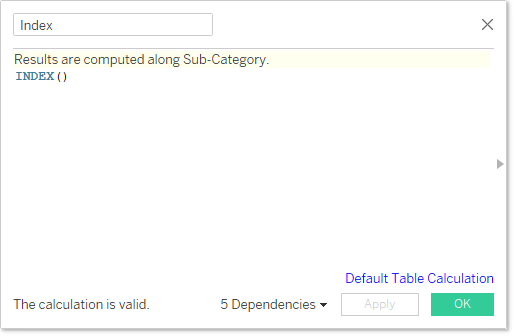
- Use the
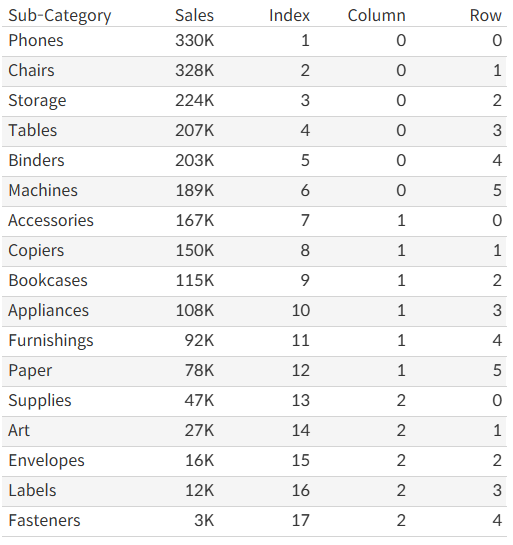
INDEX()function to assign a sequential number to each of the 17 sub-categories.
- Based on the
Indexvalue, calculate the column and row positions so that each item is placed in the appropriate cell within the 6x3 grid.
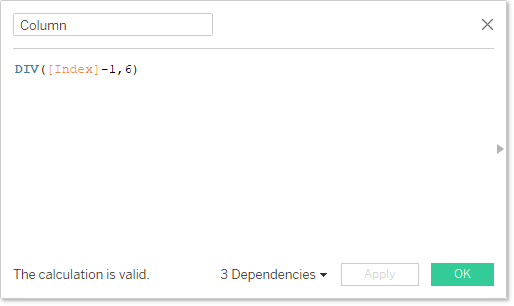
- Column
To group the 17 items into 3 columns, calculate the quotient when subtracting1from theIndexand dividing by6.
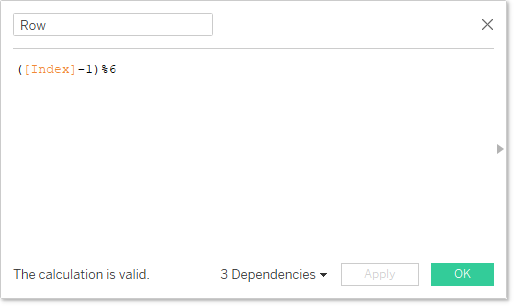
- Row
To place items into 6 rows, calculate the remainder after subtracting1from theIndexand dividing by6.
Review the results generated by the calculated fields.
- Use the calculated row and column fields to build the sheet and display all 17 sub-categories in the desired trellis layout.
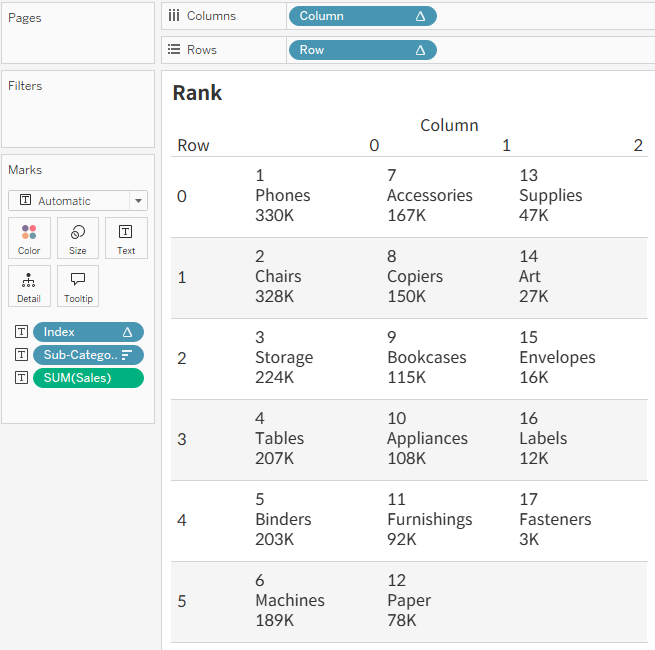
- Hide headers and adjust chart elements for a clean, grid-style look.
SQRT() and SIZE() functions to calculate a dynamic layout.