Understanding FIXED LOD Expressions in Tableau
LOD expressions allow you to perform calculations at a specific level of granularity, independent of the aggregation level currently used in your visualization. Among them, FIXED is a particularly useful function that lets you fix aggregations at a dimension level defined by the user.


The FIXED expression in Tableau works similarly to generating a virtual table based on the current data source and then performing calculations on that table. Regardless of what dimensions are present in your view, you can fix the aggregation at a user-defined dimension level using FIXED.
{ FIXED [Dimension] : AGG([Measure]) }
You can also use FIXED without specifying any dimension. In that case, the expression performs the calculation at the entire data source level. Interestingly, if no dimension is specified, simply using curly braces without the FIXED keyword produces the same result. For example, the following two expressions return identical values:
{ FIXED : SUM([Sales]) }{ SUM([Sales]) }
The FIXED LOD expression gives you explicit control over the level of aggregation, which helps ensure consistency and accuracy in your analysis. Let's look at a practical example to see how this works across different levels of data granularity.
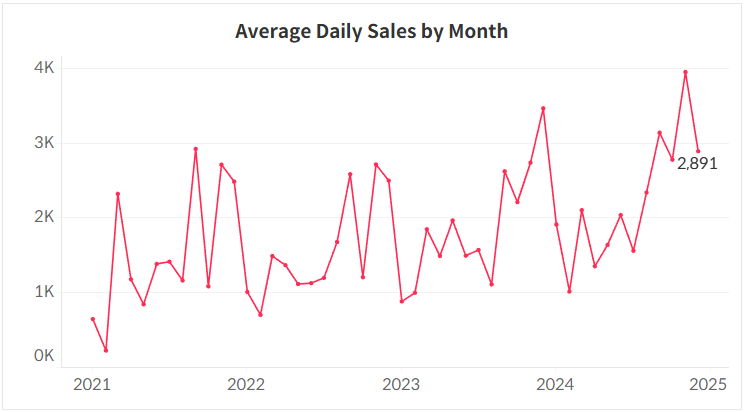
Example: Calculating Average Daily Sales by Month
Using Tableau’s Superstore dataset, we’ll calculate the average daily sales for each month to understand the monthly trend of daily revenue.
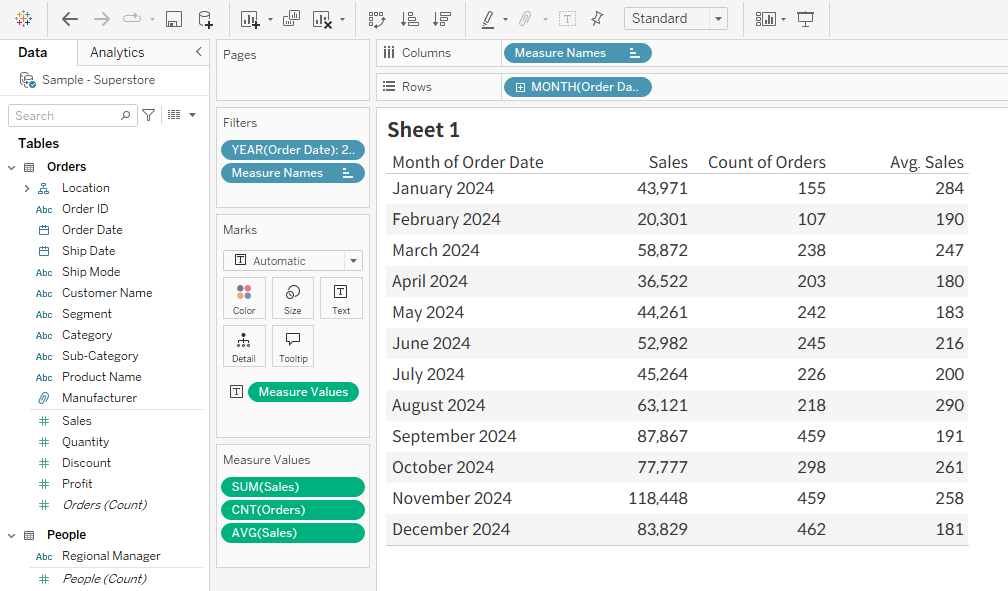
If we simply aggregate the Sales measure using the average function, Tableau will compute the average at the row level of the data, which may not align with our goal of calculating a daily average. To correctly compute the average of daily total sales per month, we need to write a FIXED expression that first aggregates sales by date, then averages those values by month.
For instance, if we examine the total daily sales in December 2024, we’ll see the sum of sales for each day. Based on this daily aggregation, we can then calculate the monthly average.
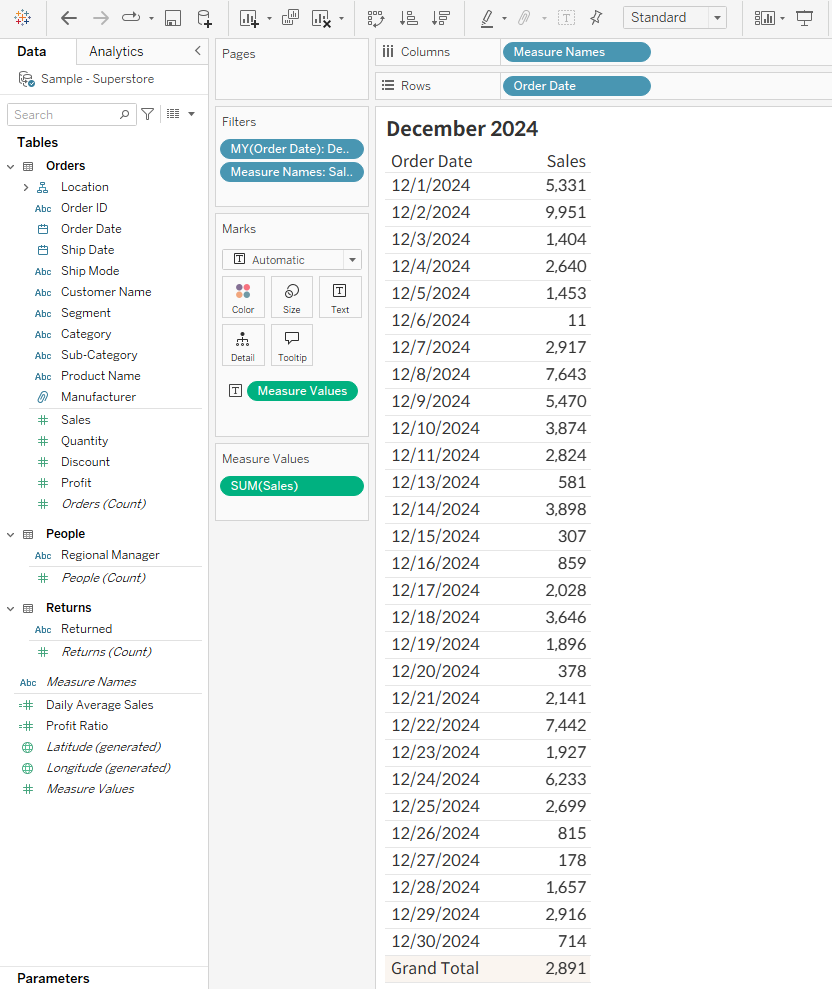
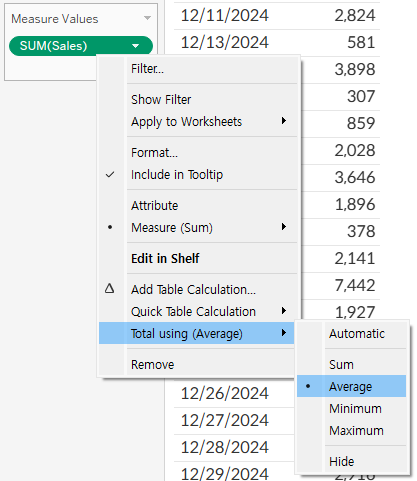
By using the Total function in Tableau, we find that the average daily sales for December 2024 is $2,891.
Here is the FIXED expression that produces the same result:
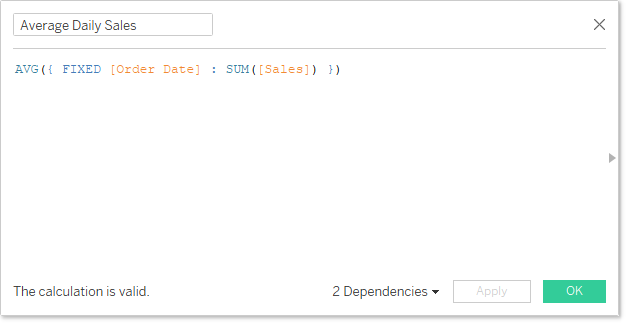
You can then take the average of this calculation over each month to get the desired monthly trend.